Tutorials
Welcome to the practical hub for the Normalized Radar Burn Ratio (NRBR). This page hosts a collection of interactive tutorials and Jupyter Notebooks designed to help researchers, analysts, and students understand, compute, and apply the NRBR index with real satellite data.
Why These Tutorials?
- 🛠️ From Theory to Code: Bridge the gap between the scientific paper and operational use. Each notebook translates a key methodological step into executable code.
- 🌍 Work with Real Data: All tutorials are designed to work with real Sentinel-1 SAR data from actual wildfire events.
- ⚡ Accelerate Your Research: Use our pre-configured code examples as a template for your own analysis of fire-affected regions anywhere in the world.
- 🔍 Promote Transparency & Reproducibility: We believe in open science. These notebooks provide the complete computational workflow behind the NRBR index, allowing for full scrutiny and adaptation.
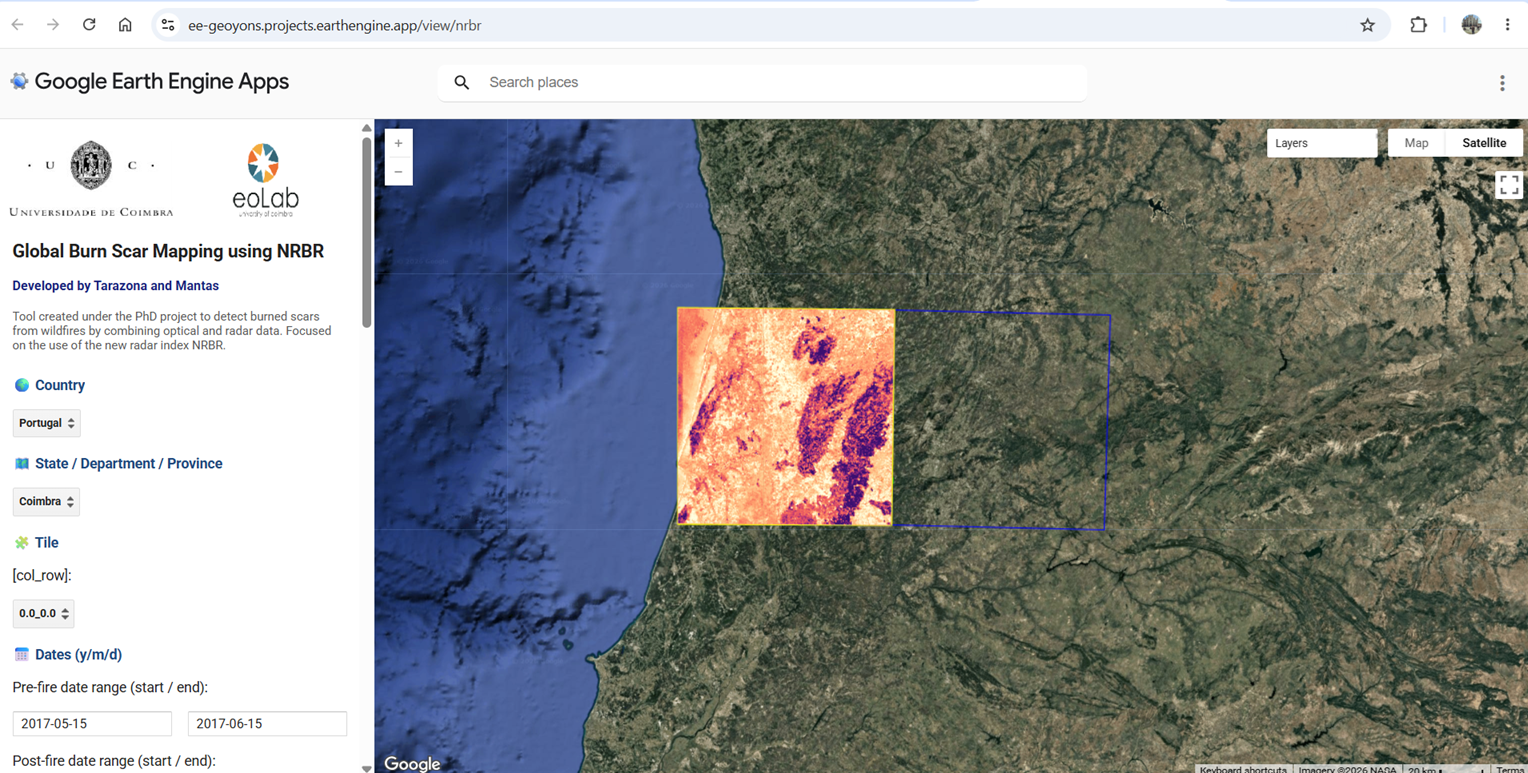
Downloading NRBR
The application enables global-scale downloads of the Normalized Ratio Burn Ratio (NRBR) index, along with dNBR (differenced Normalized Burn Ratio) and pre- and post-fire Landsat optical imagery. Users can easily filter data by selecting a country of interest, followed by a specific state or department, and finally choosing the 100×100 km tiles that cover the desired region.
Tutorial Gallery
Notebook 1: Your First NRBR Map
Notebook 2: Comparing NRBR with Optical Indices (dNBR)
Notebook 3: U-Net for Burned Area Mapping using NRBR — Part 1: Training on Large Areas
Notebook 4: U-Net for Burned Area Mapping using NRBR — Part 2: Prediction & Mosaicking